Carbon Dating: How old is it really?
(This is a variation of an article first published in “Chronology & Catastrophism Review” 2013. It also comprises the bulk of Chapter 3 in Science and Religion: Reconciling the Conflicts, 2013.)
Radiocarbon dating is not employed to test theories, but to support them . . .
radiocarbon always gives a scattered set of dates.
The theorists then pick the ones they believe to be correct.
—Charles Ginenthal, 1997
Many of the most obvious conflicts between science and religion involve timing issues—the dating of events in Earth’s history. Bible chronologies typically list Adam and Eve at about 4,000 BC. In contrast, science textbooks can hardly be found that do not refer to human or “pre-human” remains 10,000 to millions of years old. Why the discrepancy?2
A Valuable Tool, But With Limitations
Since the 1950s, the carbon-14 system has achieved a particularly high prominence. Thomas Higham described it:
Radiocarbon dating has been one of the most significant discoveries in 20th century science. Renfrew (1973) called it “the radiocarbon revolution”…. Desmond Clark (1979) wrote that were it not for radiocarbon dating, “we would still be foundering in a sea of imprecisions sometime bred of inspired guesswork but more often of imaginative speculation”. . . .
According to one of the scientists who nominated Libby as a candidate for this honour [the Nobel Prize in Chemistry]; “Seldom has a single discovery in chemistry had such an impact on the thinking of so many fields of human endeavor. Seldom has a single discovery generated such wide public interest.”3
Theoretically, carbon dating can be used to estimate the ages of once-living samples as old as 40,000 years, although some earlier claims were as high as 100,000 years.4 Due to the minute amounts of carbon-14 in any specimen, “the radioactive emanations from older objects are difficult to separate from background radiation.”5 “So few parent atoms remain after seven or eight half-lives (less than 1%) that experimental uncertainty creates a limit for radiometric methods.”6 (Note: for simplicity, in this paper carbon-14 is usually written “C14,” however, when variants such as “C14,” “14C” or “C-14” appear within a quote, they are shown as they were published.)
Contrary to popular perception, carbon dating is not a precise answer-all to chronology questions. This fact is openly recognized by scientists involved in the field. For instance, T. C. Aitchison and E. M. Scott wrote: “It has long been acknowledged, though not always fully acted upon, that radiocarbon dating measurements are not definitive, i.e. they do not produce precise age estimates.”7
Failing to acknowledge this lack of precision, a Nova program that aired in 2009 showed a paleontologist who had found a skeleton of an extinct animal deep in a cave. The narrator indicated that they have samples dated “because they want to know exactly how old the skeleton is.”8 Sorry—but the scientific dating methods are tools for estimating ages—not determining them exactly.
At the Proceedings of the Twelfth Nobel Symposium on carbon dating, an important detail about how carbon-14 dates are actually used was shared:
A famous American colleague, Professor Brew, briefly summarized a common attitude among archaeologists. . . .
“If a C14 date supports our theories, we put it in the main text. If it does not entirely contradict them, we put it in a foot-note. And if it is completely ‘out of date,’ we just drop it.”
Few archaeologists who have concerned themselves with absolute chronology are innocent of having sometimes applied this method.”9
Although the symposium was held in 1970, the point is still relevant. It would seem that practices should have improved as technology advanced—but more recent accounts suggest that the accuracy of the results hasn’t changed much. For example: “Nobody cites the many hundreds of C14 dates . . . from Thera. According to C14, Thera erupted c. 1660 BC . . . a date which is more than 110 years too early for even conventional historians. C14 dates are still only cited when they agree with your chronology!”10
How Carbon Dating Works
Carbon-14 is radioactive—therefore, it decays over time. It can be used as a dating tool because creatures and plants accumulate it during their lifetimes, and cease doing so when they die. The system is conceptually very simple. If four essential facts are known, an age can be calculated with precision. They are: (1) the C14 concentration in a specimen at its time of death; (2) the decay rate of C14; (3) the current C14 concentration in the specimen being “dated”; and (4) if anything else has affected the specimen’s C14 content. Note: only the third of those four necessary facts can be measured, the other three must be estimated, assumed, or extrapolated.
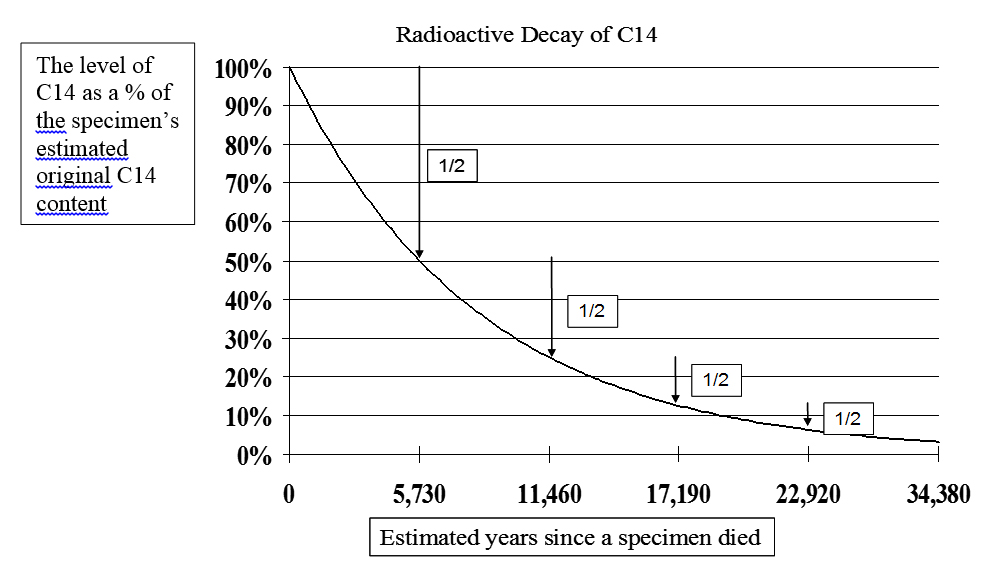
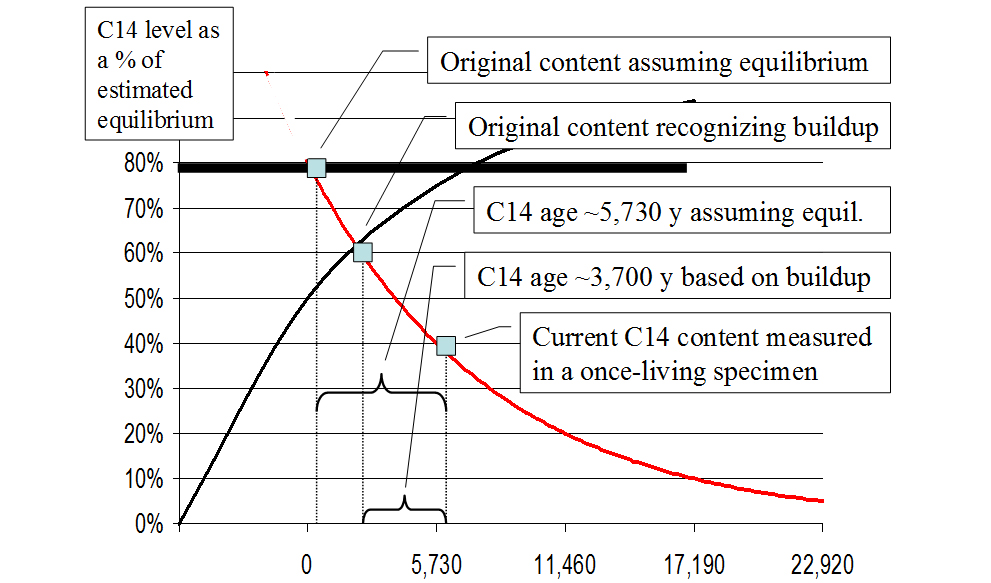
Radioactive decay causes once-living specimens to lose half of their C14 atoms in about each 5,730-year half-life. Thus, if the level today is half of what it was estimated to be when the thing died, it is said to be 5,730 years old. If its current level is only one quarter of the original estimate, 11,460 years old, and so on. See Figure 1.
Essential Fact #1: The Original Content
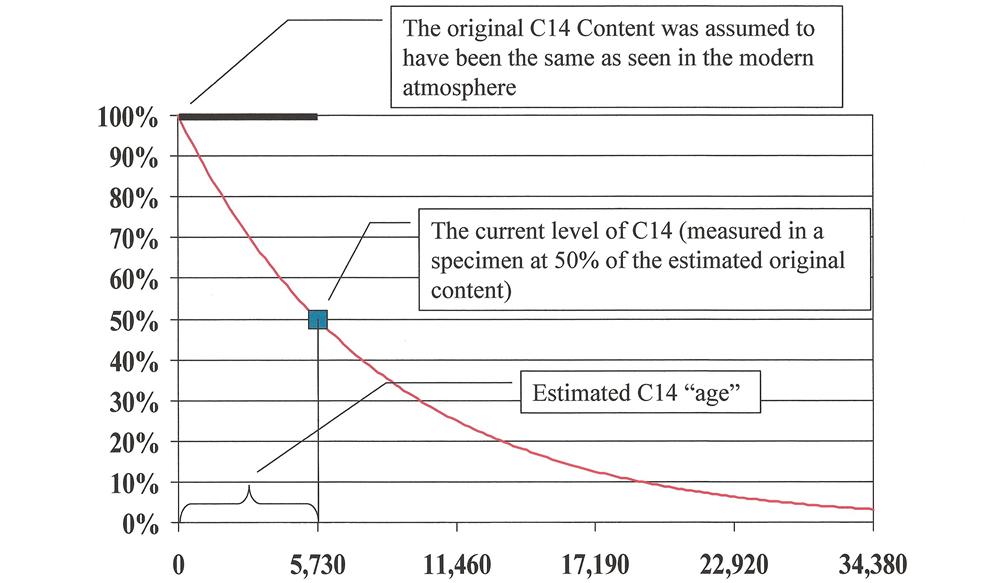
Since scientists aren’t able to take sophisticated equipment back in time to actually measure the C14 concentration when a plant or animal died, it is necessary to estimate. It was natural for Willard Libby, the inventor of the method, to assume uniformity in this estimation.11 No doubt, he had been taught it from his youth, and he reasoned that living things in the past must have had the same C14 levels as seen in living things in modern times. Therefore, he used modern C14 levels to approximate the ancient.12 This is graphically represented in Figure 2.
Testing has not verified Libby’s assumption of uniformity. Indeed, experiments have led to a startling conclusion: that C14 levels in the past were lower than they are now. If the experimental data was correctly collected and interpreted, Libby’s assumption in estimating the original content is wrong.13 That assumption error causes C14 dates to appear “older” than the actual ages of the specimens dated. (See the “Assumption Error” section later in this paper for more details.)
Essential Fact #2: The Decay rate of C14
The decay rate of C14 is estimated by comparing measurements taken in the recent past with C14’s current radioactivity levels. Early estimates of C14’s half-life ranged from 1,000 to 25,000 years.14 The 5,730-year half-life was selected as the standard at the 5th Radiocarbon Dating Conference at Cambridge University, July 1962. Immediately prior to that time, some labs had been using 5,568 years, which introduced undesirable discrepancies in age estimates.15 More recently, 5,715 years was published for C14’s decay rate.16 C. Bronk Ramsey noted: “The half-life is really not that well known and some scholars think that it may be substantially longer, perhaps as much as 6000” years.17
Alasdair Beal noted a frailty in estimating the half-life: “It is worth remembering that the half-life of C14 used in the calculations (5,730 years or thereabouts) has been calculated from measurements taken over only a few decades. It is also worth remembering that in a sample from 3000 BC the C14 content is now only diminishing at a rate of 0.0066% per year, . . . it would take only slight contamination to affect the result.”18
Although there is still some uncertainty regarding the precise decay rate of C14, perhaps a more important question is whether the decay rate is consistent over time. Experiments have been performed to try to determine if radioactive decay rates can be affected when the materials involved are subjected to unusual conditions. As early as 1954 Kalervo Rankama reported: “the decay constant may be slightly altered by putting the nuclide in a different chemical combination or physical state.”19 A more recent report suggests:
The constancy of rate of radioactive decay in all physical and chemical conditions is the mainstay of radiometric dating. However, “changes in radioactive decay constant depending on the physical and chemical environment of the nuclide have been known for 40 years.” In particular a researcher . . . found that with a mixture of titanium and radioactive tritium “its radioactivity declined sharply” as it was heated from 115 to 160 degrees C. As the discovery was not of direct relevance to the research involved it was not published until 1994, when it appeared to have relevance to the problem of “cold fusion.”20
That test involved other radioactive elements, but it showed that radioactive decay rates can be altered, thus creating more uncertainty regarding the second of the facts essential to precise C14 dates. Other things affecting decay rates were mentioned by G. Brent Dalrymple, including electric fields, pressure, and chemical combination.21
Radioactive decay is described as “spontaneous.” In other words, “not due to any known cause.”22 What if a cause is identified some day? Some scientists already favor the idea that sub-atomic particles such as neutrinos may affect radioactive decay. Frederic Jeuneman expressed this thought in 1972. He suggested that a supernova—one that is believed to have exploded about 11,000 years ago and only 1,500 light-years away—could have thrown dating measurements into a “cocked hat!” “Being so close, the . . . neutrino flux of the superexplosion must have had the peculiar characteristic of resetting all our atomic clocks.”23
Alvin J. Sanders also suggested that neutrinos affect the process: “The precise value at any given time of the ‘half-life’ of any unstable isotope including 14C—must now be considered in doubt, since the Jenkins-Fischback effect implies that we may no longer view the decay rate of an isotope as intrinsically governed and therefore a constant in Nature.”24
Supernova 1987-A was studied carefully by scientists. It was the first exploded star close enough to Earth and large enough for detailed analysis—made possible by the emplacement of modern neutrino-detection equipment. Roland Pease reported that it was the only supernova that could be seen well since 1604.25 Although it was outside our galaxy, estimated to be 160,000 light-years away, “a 100-fold spike in the neutrino counting rate, a peak never seen before or after”26 was discovered by detectors both in the Japanese Alps and in a salt mine under the shore of Lake Erie. Thus, neutrinos and other sub-atomic particles from nearby supernovas may have had an important effect on radioactive decay.
The decay rate may not be certain, or everlastingly set, however, it appears to be consistent enough to be useful in the formula for C14 date estimates during historical times.
Essential Fact #3: Measuring Current Levels
Measuring the current levels of C14 in a specimen is—by far—the most precisely determinable of the four essential facts. With the advent of AMS technology,27 scientists can determine the current composition of a sample with an impressive level of precision. However, “AMS tends to be significantly more expensive than decay counting,”28 and the less-precise technique is often employed.
Essential Fact #4: Has Anything Else Affected the Specimen’s C14 Content?
This component of the formula is the most difficult to estimate due to the incalculable number of variables and unknowns. Contamination of some samples has been identified, leading scientists to take extra precautions in order to protect specimens. Testing the accuracy of this required fact is limited and subject to a huge array of possible assumptions.
Where does Carbon-14 come from?
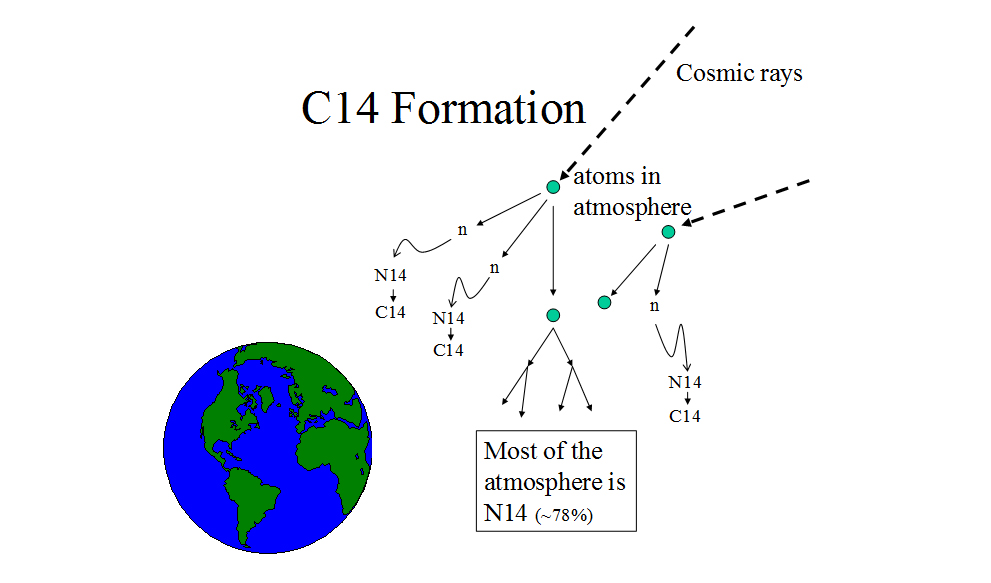
Carbon-14 is rare,29 and it forms when nitrogen-14 (N14) reacts with free neutrons.30 Neutrons are “freed” from their nuclear bonds in chain reactions when cosmic rays
collide with atoms in Earth’s atmosphere.31 C14 has the same chemical properties as C12 and C13 (stable isotopes of carbon),32 and any of the carbon isotopes can react with oxygen to form carbon dioxide, which enters plants “as a result of photosynthesis and by absorption through the roots.”33 Plants are eaten by animals, and living things on Earth become ever-so-slightly radioactive due to ingesting things containing C14. When something dies, it no longer assimilates C14, at least not by the means described above. If an artifact is preserved from physical decay and leaching of chemicals, radioactivity may be the sole means whereby it gradually loses its C14.
Assumption Error
Libby assumed that C14 levels must have remained constant during at least the last 20,000 to 30,000 years.34 Therefore: “a steady-state condition should have been established, in which the rate of formation of carbon-14 would be equal to the rate at which it disappears to reform nitrogen-14.”35
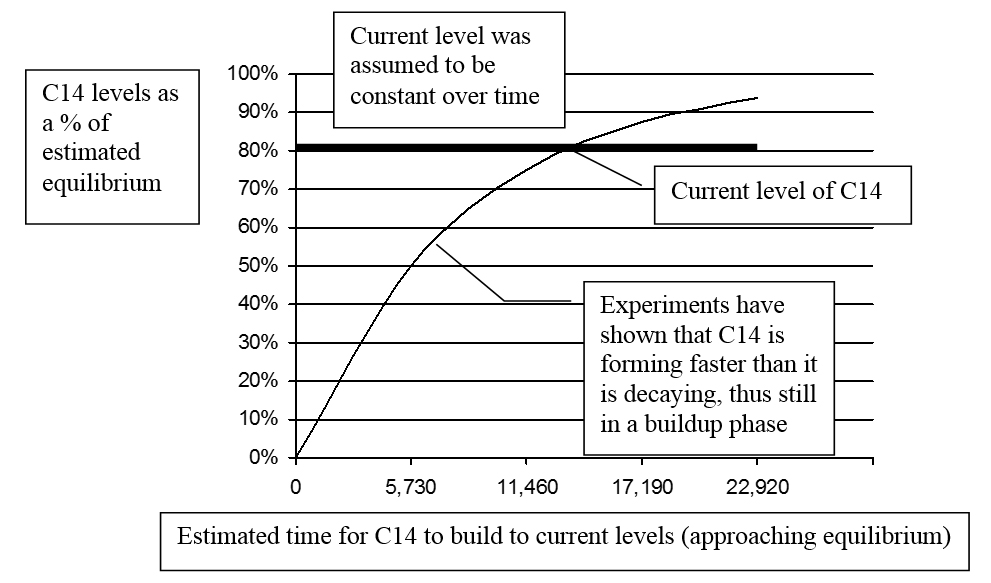
To test the assumption, the rate that C14 forms in Earth’s atmosphere was estimated (based on measurements from various locations around the globe). This was compared with C14’s decay rate. The testing indicated that C14 is forming faster than it is decaying. A simple analogy may be helpful: Suppose water is steadily dripping into a large tub. As long as water drips in faster than it escapes, the water-level increases. If it reaches a point where the rate water is dripping in is matched by the rate it escapes, it is in a steady-state or equilibrium. Similarly, for C14 to be in a state of equilibrium, its formation rate would need to be matched by its decay rate.
Initial estimates indicated the formation rate was “about 10 percent” higher than the decay rate. This difference was attributed to “experimental errors.”36 Other measurements were made, and a startling conclusion was reached. In 1963 R. E. Lingenfelter (one of Libby’s collaborators) wrote: “There is strong indication, despite the large errors, that the present natural production rate exceeds the natural decay rate by as much as 25%.”37 Here is a perplexing question: If this was true in 1963, what logical deduction can be made about the distant past? Isn’t it that C14 has likely been building for some time, and thus, past levels were lower than current? In 2008 Ramsey suggested that the production rate of C14 “is surprisingly poorly known” and that “further fundamental research is certainly needed.”38
It seems an odd twist of logic to ignore the strong experimental evidence, and instead assume that C14 levels have been constant for many thousands, if not millions of years! Are there any compelling reasons to continue to assume what appears to be erroneous? There is one that is very persuasive: if C14 has been building for thousands of years, the assumption of uniformity in the atmosphere is wrong, and the current concentration of C14 is not an acceptable estimate for the past levels. What a horrible thought for staunch uniformitarianists! Could this be the main reason most scientists ignore the evidence for non-equilibrium? Perhaps it is—but the most common cause is likely ignorance of these details.
Another compelling reason seems to be that the C14 dating system has already been adjusted (calibrated) to fit better with tree-ring dating—which has been used to adjust conventional chronology. Changing it would upset the apple cart—that is, it would again cause the C14 dates to be out of sync with the claimed “historical dates.”
Since the C14 levels appear to be increasing, how does one correctly estimate the original content of a specimen? Using the difference between the formation rate and the decay rate, a buildup curve may be derived—as Cook has done.39 Simplified versions of his graphs are presented in Figures 4 and 5.
If the buildup curve as shown in Figures 4 and 5 is reasonably accurate, the original C14 content of the specimen (represented by the small square at the intersection of the buildup and decay curves) would have been only about 60% of equilibrium rather than the assumed 80%. Thus the older the artifact, the less C14 it originally contained at its time of death, and the greater the error of those C14 “ages” which fail to take this into consideration. Cook wrote: “I raised an issue [non-equilibrium] in 1955 that to this day has not been successfully rebutted.”40
“Known” Historical Dates
From the beginning of the C14 system, discrepancies were found between its dates and the supposed “known dates” from historical and archaeological sources. The “historical dates” were often “older” than the ages obtained from C14. In 1965 Libby wrote:
At the present time, radiocarbon dates seem to be accurate within one or two centuries back to about 3500 years ago and possibly to 4000, but beyond that there appears to be a discrepancy between the Egyptian historical and radiocarbon dates which increases to some 500 years or more. . . . It may be, of course, that this is historical error rather than error in the radiocarbon dating method.41
Since then, evidence has been amassed showing that many of the “known historical dates” were wrong by a significant margin. Serious studies by chronologists have led to major revisions of the Egyptian dating (see chapter 9 of Science and Religion for some specifics). In the mean time scientists had adjusted the C14 system to fit erroneous Egyptian dates.
It is ironic that since C14 dating was “corrected” (calibrated) to fit the older dates, it is now out of sync with the corrected historical dates. Paul Damon et al. wrote: “The key date for fixing the time the Egyptian Middle Kingdom and the periods preceding it is the seventh year of the reign of Pharaoh Sesostris III of the Twelfth Dynasty. This date is fixed by a heliacal rising42 of the star Sirius.”43 Although Damon referred to it as a “fixed” date, a number of contrary estimates for the age of this event have been claimed. I have collected thirty-two different dates from published sources attributed to the beginning of Sesostris III’s reign. They range from 1300 to 2099 BC. Nineteen of them were radiocarbon dates that range from 1300 to 1895 BC. This so-called fixed date is by no means certain.
Calibration from Tree-ring Dates
As carbon dating gained acceptance it was believed necessary to calibrate the results of the technique to agree with tree-ring dates.44 Pearson et al. suggested more than one calibration was needed.45 However, calibration has led to dates substantially older than those from uncalibrated C14 date estimates.
R. M. Porter criticized an introductory statement made at the 17th International C14 Conference by H. Bruins indicating his “confidence in 14C’s ability to solve all problems overlooks the fact that 14C dates have to be corrected by dendrochronology [tree-ring dating].”46 Bernard Newgrosh was also critical of the C14 calibrations when he wrote: The “adoption of calibrated radiocarbon dates has led to artificially stretched chronologies and non-existent ‘dark ages.’”47 Porter noted:
By 1977 calibration had arrived. Callaway and Weinstein. . . . admitted that they had to reject almost all of the previously published Ai dates as “deviant.” For some of these they had sent fresh test pieces—from the same specimens—for a retest at Texas and also at Pennsylvania. Both laboratories gave results which again roughly agreed with conventional dates. These results, however, incorporated radiocarbon calibration. If one looks at the “raw” radiocarbon results, before calibration, there is effectively a 600 year difference between the later and earlier results on the very same specimens!48
Circulation Lag in the Oceans
In the early days of carbon dating it was assumed that various segments of the biosphere would contain roughly equal levels of C14. Libby noted that one predicted difference was that “sea shells should differ and be richer in C-14 than organic matter in general; yet we find . . . that this is not so.”49 Goodfriend and Hood noted: “Shell organic carbon is largely derived from plant material but apparently also contains carbon derived from . . . bicarbonate. This makes it subject to a small age anomaly (estimated at up to ca 150 years) due to incorporation of carbon ultimately derived from limestone.”50
Libby estimated that it would take about 1,000 years for C14 to mix with and spread throughout the oceans after forming in the atmosphere.51 More recently, Shackleton et al. presented actual lag time data for surface water in the eastern Pacific Ocean indicating it “has an ‘age’ of ~580 yr whereas deep water has an ‘age’ of ~2,100 yr.”52 In addition, “errors in radiocarbon age may be as much as 3000 years for shell samples from rivers.”53
Certain other watery environments can cause the carbon levels of some samples to contain diluted amounts of C14, depending on the nature of the source of the water.54 A specific instance was mentioned by Libby: “It has recently been shown that a New England lake whose bed was entirely ancient limestone and which was fed mainly by water leached through ancient limestone . . . whose radiocarbon content was only 77 ± 2 per cent of the value for the carbon in modern wood.”55 Thus something living in that lake would have a C14 content only about 77% of expected, and an uncorrected radiocarbon “age” of about 2,200 years.
Douglas J. Keenan studied the effects of C14 variations in portions of the Mediterranean, and noted: “The existence of three widely-separated dates with such high statistical confidence implies that there are serious problems with the statistical analyses that were employed. Hence, almost any conclusions based on those analyses should be regarded as being at least questionable.”56
Charcoal and Bones
Charcoal and bones are favorites among archaeologists as carbon dating candidates. Although they are often dated, the accuracy of their age estimates is in question. J. Van der Merwe reported: “Charcoal which is buried in the ground is subject to contamination by rootlets, carbonates, and humic acid.”57 Jesse Lasken also noted difficulties:
“The same standard techniques are too frequently used in ignorance to combine the results of determinations of dissimilar events or materials (e.g. heartwood charcoal and animal bone). Such combinations give an unjustified air of precision to a date, and they disguise real uncertainty.”. . .
. . . Since the wood could have come from the inner rings of an old tree,58 its radiocarbon age could vary by centuries from the time of the historical event with which it is associated.59
R. E. Taylor indicated:
Discussions concerning the reliability of 14C-based age determinations on bone have occurred throughout all four decades of radiocarbon research. . . . Despite the amount of attention given . . . a tradition of skepticism concerning the general reliability of bone 14C values remains. . . .
From the point of view of the archaeologist or paleoanthropologist, this is an unfortunate situation, since bone material is present in many sites where other organics are not. . . .
. . . Carbon-containing inorganic materials . . . are transported into the bone matrix from the groundwater and soil environment by chemical exchange.60
In other words, since bones can absorb minerals containing carbon through soil and groundwater, their C14 content can be altered—causing “dates” to appear younger, or older, than the actual age of the bone. Can other materials be similarly affected by chemical exchange?
Inconsistencies with Other Methods
Although most of the geologic dating procedures are used to estimate ages believed to be much older than the C14 dating, one that is claimed to overlap is the Uranium-Thorium (U-Th) method. Unfortunately, the results have not been consistent. For things that lived more than 9,000 years ago, according to Bard et al., “the 14C ages are systematically younger than the U-Th ages, with a maximum difference of ~3,500 yr at ~20,000 yr BP.” They then suggested that the Uranium-Thorium technique can be used to calibrate carbon dating beyond the realm of tree-ring calibrations.61 Here is another example where, a different dating method produced older age estimations than C14, and it was assumed that the C14 method was less accurate.
Bard et al. also noted that various techniques produce different “dates” for the same samples. Large discrepancies have been found between Carbon-14 and potassium-argon “ages” as well as between C14 and thermoluminescence.62
What causes people to suppose that less-testable methods such as U-Th, and K-Ar, are more accurate than the C14? Could it be the preference for “older” dates? What historical dates can be used to check their validity? There are none. Wouldn’t it be more logical to first fix the C14 system for known problems, and then use it to calibrate the other overlapping methods?
Misleading Terminology
Two terms frequently used in describing scientific age estimations are misleading, namely “absolute date” and the “±” (plus or minus) symbol. “Absolute date” gives the impression—at least to non-scientists—that the age listed is certain, or assured to be correct. However, in common scientific usage it simply means the date estimate is expressed in years. The following definition is fairly typical in science texts: “We can consider geologic time from two points of view: as relative or as absolute. Relative time—that is, whether one event in Earth history came before or after another event disregards years. . . . On the other hand, if we can determine [estimate] how many years before the present an event took place—whether it was 10,000 years or 60 million years—we deal in absolute time.”63
The definition of “absolute time” found in the Dictionary of Scientific and Technical Terms states: “Geologic time measured in years, as determined by radioactive decay of elements.”64 The words “absolute,” “measured,” and “determined” imply much more confidence than the dating processes deserve. The definition would be more accurate if the terms were replaced by some that accurately depict the uncertainty. In her introductory remarks to Nuclear Methods of Dating, Etienne Roth expressed more clearly that “absolute” referred to “an estimate . . . expressed in years.” She also noted that “the term is questionable because of the uncertainties which still affect established time scales.”65
When the plus or minus symbol (±) is used to portray the margin of error in C14 dates, it is particularly misleading. For example, a C14 age expressed as “3,000 ± 100 years” leads readers to believe that the age is assured to be accurate within 100 years of 3,000; that the thing being dated almost certainly died some time between 2,900 and 3,100 years ago. What it really represents is the laboratory’s estimate of the accuracy of their measurement of current levels of C14 in the specimen. Thus, the margin of error is based on only one of the four essential facts for accurate date calculations—and the most precise one at that. Aitchison and Scott described an additional concern:
Every radiocarbon age has an associated error term of which a major component is the counting error of the radioactive measurement process. . . . The quoted error terms are estimated in different ways by different laboratories. . . .
. . . Analysis of the results from twenty laboratories throughout the world suggest that commonly quoted counting errors should be approximately doubled and that several of the laboratories which participated in the study were systematically biased with respect to others and to the overall trend by an amount up to several hundred years.66
Although only taking into account a small portion of the many uncertainties, scientists are at least recognizing that the stated precisions (±) are not to be relied on.67 Pearson, Pilcher, and Baillie noted: “The error associated with the 14C date, ie, the precision quoted . . . should include all inaccuracies, the error in the calibration, the choice of sample material and knowledge of the growth period.”68 Although they only listed three out of the large number of factors which can contribute to inaccuracy, they were on the right track.
Scientists presumably do not use this terminology to deliberately mislead readers, nevertheless laymen and scientists who haven’t studied the details can, in fact, be misled. I remember being intimidated by such terms in my early chronology studies, particularly when a date I was working on was outside the claimed precision range of a corresponding carbon date, or an “absolute date” contrary to my findings—not so now.
Conclusion
Of the four facts essential to precise carbon dating: The first (the original C14 content) is based on an assumption—one that is contradicted by experimental evidence. The second (the C14 decay rate) appears to be accurate enough to support the system during historical times. The third (the current content) is by far the most sure of the four (when AMS is used). And the fourth (other factors that may have affected the process) presents serious problems. Newgrosh expressed his concern: “Radiocarbon dating is based on assumptions which are now known not to hold true. If we were going to re-invent the method, knowing what we do about those assumptions, there is a real possibility that the method would now be deemed inadmissible.”69
Ramsey cautioned: “Although the measurements have become markedly more precise . . . , this means that we need to be even more careful now about the chain of reasoning that allows us to go from a radiocarbon measurement to an understanding of chronology.”70
Despite its weaknesses, radiocarbon is a valuable tool for estimating dates of once-living things—as long as people realize that it produces only estimates, not precisely accurate dates. Although the errors increase with the actual age of the specimen, dates of things that died after about 2000 BC are usually close enough to be useful. Earlier dates appear to be grossly inaccurate and should be “put on the shelf.” Until more facts are built into the estimation formula and the known problems are corrected, the inaccuracies will persist. The C14 dating technique would be much better if many of the so-called corrections made in the past, which were based on faulty information, were abandoned. Then revisions could be made to account for non-equilibrium and other known effects. Dates prior to about 4,000 BC (the time usually attributed to Adam) should be considered spurious (to those of us who believe that the fall of Adam introduced profound physical changes into the world).
Those who have read and understood this paper thus far should be able to see inconsistencies in the following quote:
We know very little about the earliest inhabitants of the Nile Valley because no human remains have been found from that period. We do know that the area was first inhabited around 500,000 B.C. by settlers who had as their only tool the hand ax. This marked the beginning of the Paleolithic, or Stone Age, Period. By modern standards change was slow. When we think of the changes in our civilization in the last hundred years, it is almost inconceivable that in the first 450,000 years of Egyptian civilization the only improvement was a better hand ax!71
I do not wish to demean the author of the preceding quote, because much of the information in his book is excellent, but he has obviously been indoctrinated by the assumptions popular in dating. Two of his statements deserve criticism:
- “We know that the area was first inhabited around 500,000 B.C.” How is this known? This statement cannot be based on carbon dates since realistic estimates only claim theoretical ages up to about 40,000 years. On what then was it based? Particularly, what assumptions? Wouldn’t it have been more accurate to say something like: “The . . . [naming the estimation method used] suggests that the area was first inhabited around 500,000 B.C.”? Yes it would! Was he concerned that such wording, though more accurate, would inspire a lack of confidence among his readers?
- “It is almost inconceivable that in the first 450,000 years of Egyptian civilization the only improvement was a better hand ax!” Almost inconceivable indeed! On what basis was this almost inconceivable idea conceived?
Even after realizing that the C14 dating technique has been calibrated using tree-ring dating and indirectly conventional Egyptian chronology, some fail to recognize the significance. For example Paul Standring reported an odd position held by Baillie: “I believe the revisionists [of Egyptian chronology] are wrong because calibrated radiocarbon dates broadly support the conventional Egyptian chronology. For the revisionists to be correct, calibration and dendrochronology would have to be wrong and that is not possible [sic] given the degree of tree-ring replication.”72 If one method has been adjusted to fit the other because the other was thought to be more accurate, then when they agree, it is merely a tautology.73 Another question has been raised: had Libby—earlier in his studies—openly acknowledged that the formation rate of C14 was significantly higher than its decay rate as experiments have shown, what would have been the ramifications? Had he done so, his system would have directly challenged the fundamental assumption of uniformity. Would it then have been the means of his receiving a Nobel Prize, which it was, or might he have been ostracized and labeled a pseudo-scientist like many others who challenged popular thinking?
Once the deficiencies in C14 dating are recognized, the conflicts between radiocarbon dates and those from the scriptures are reconcilable. However, a resolution of the problem is a challenge for scientists who ask the out-of-the-ordinary questions and dare to pursue the answers.
ADDENDUM: Carbon 14’s Effect on Longevity
Dr. Melvin A. Cook proposed that higher levels of C14 in the biosphere since the Flood contributed to a significant decrease in human lifespans. To understand the ramifications, recall that carbon is a primary building block of life on Earth. Although radioactive carbon (C14) is only estimated to be .00000000010% of the total of naturally occurring carbon,74 like other radioactive elements, the decay process can damage living cells. Life forms apparently do not distinguish C14 from C12 or C13. As they assimilate carbon in the growth process, they do so in the same proportion it is found among other isotopes of available carbon.
At some time in Earth’s history, a vast portion of the total carbon in the biosphere was “locked out.” That is, it was removed from the reach of living things by burial. The vast coal, oil, natural gas, limestone, and similar deposits composed of once-living matter that lie beneath the surface of the earth attest to that fact. Although there is no dispute that vast quantities of carbon were removed from the biosphere, there is ongoing debate about whether that burial was slow or sudden. It has been proposed that the carbon was locked out suddenly in conjunction with the Flood/continental shift event.
Before the carbon was buried, there was a substantially larger amount of total carbon available for living things to assimilate at or near Earth’s surface. Thus, C14 was much more dilute, having been mixed with a much larger carbon pool at that time. So prior to the great Flood, as living things ingested carbon, they did so at a significantly lower dose of radioactivity.
To understand, an analogy may be helpful: Picture a large aquarium filled with non-radioactive carbon atoms (C12 and C13). Imagine that carbon has the appearance and properties of clear water. Now suppose that C14 atoms also have the properties of water, but are a very dark-purple color, and toxic. Then, an apparatus starts to drip the dark purple C14 atoms into the aquarium at a rate of one drop each hour. Because the dark purple fluid would dissipate throughout, it would take quite some time before the clear water-like substance would start to discolor.
Now suppose that half of the mixture in the aquarium is suddenly removed and buried. Immediately after removal, the remaining half would have the same concentration as before, but as the drops of the radioactive C14 continue to be added each hour, the mix continues to discolor. Since no more C12 or C13 atoms are added, and since the C14 is dispersing amidst a smaller volume of carbon, its concentration increases at a faster rate.
Compare this analogy with the C14 forming and mixing amongst the other carbon atoms remaining in the biosphere after the Flood. Apparently, since Creation, C14 has been building as a result of the cosmic rays’ interaction with Earth’s atmosphere, but C12 and C13 have not. As C14 atoms were formed, they mixed with the other available carbon isotopes in the reservoir. Since that reservoir was much larger before the Flood/continental shift event, the concentration of radioactive carbon within the carbon
mix was much less. After the Flood, a much smaller reservoir was available in which newly forming C14 could disperse. Over time, the reservoir became more and more concentrated until it reached its current level. Therefore, before the Flood any living thing
absorbing carbon did so from a mixture much less concentrated in C14. After the Flood, anything obtaining carbon from the reservoir (which was increasing in C14 concentration more rapidly), would have receive a higher dose of radioactive carbon.
If the continents did slide suddenly, there is no doubt that some things would have subducted (or been buried) beneath other parts of the crust. Although the common tectonic theory is generally associated with the assumption of slow continental movement, if its timing is modified, it seems to fit with the flood hypothesis proposed earlier in this book. Ham et al. summed up the idea quite nicely: “The Genesis flood would have greatly upset the carbon balance. The Flood buried a huge amount of carbon, which became coal, oil, etc., lowering the total [carbon]… in the biosphere.… Whereas no terrestrial process generates any more 12C, 14C is continually being produced.… Therefore the 14C/12C ratio in plants/animals/the atmosphere before the flood had to be lower.”75 Since radioactivity damages living cells and can cause cancer and other diseases, if radioactive C14 really has been increasing in concentration since the Flood, the higher levels of C14 in humans would naturally decrease longevity.
- See Cook. Scientific Prehistory. 1993, p. 11. This is a simplified version of his Figure 2-1.
- The information in this article is based primarily on the writings of Dr. Melvin A. Cook, and his sources. This is a simplified version intended to be understandable to non-scientists.
- Higham, Thomas “Radiocarbon Web-info.” http://www.c14dating.com/int.html, p. 1.
- Baillie, M.G.L. Tree-Ring Dating and Archaeology. 1982, p. 223.
- Hedges and Gowlett. “Radiocarbon Dating by AMS.” Scientific American, Jan. 1986, p. 100.
- Pipkin. Geology and the Environment. 1994, p. 36.
- Aitchison and Scott. “A Review of Calibrating.” In Applications of Tree-Ring Studies. 1987, p. 188.
- Nova: Bone Diggers. Air Date June 19, 2007.www.pbs.org/wgbn/nova/nature/bone-diggers.html. (last accessed 9/19/12)
- Säve-Söderbergh and Olsson. “C14 Dating and Egyptian Chronology.” In Proceedings of 12th Nobel Symposium. 1970, p. 35.
- Notes and Queries. “Tutankhamun radiocarbon dates.” C&C Review. SIS, 1996:1, p. 34.
- Libby. “Accuracy of Radiocarbon Dates.” Science, Vol. 140, no. 3564, April 19, 1963, p. 278.
- Otlet. “Impact of Atmospheric Carbon-14.” In Radiocarbon after Four Decades. 1992, p. 529.
- See Cook. Scientific Prehistory. 1993, pp. 10-22.
- Arnold. “Early Years with Libby at Chicago.” In Radiocarbon after Four Decades. 1992, p. 3.
- Libby. “Accuracy of Radiocarbon Dates.” Science, April 19, 1963, p. 278.
- CRC Handbook of Chemistry and Physics, 72nd ed. 1991, p. 11.29.
- Ramsey. “Radiocarbon Dating.” Archaeometry, Vol. 50, #2, 2008, p. 9.
- Beal. “A Bit Creaky?” C&C Review. SIS, 1991, p. 40.
- Rankama. Isotope Geology. 1954, p. 63.
- Monitor. “Radioactivity declines with temperature.” C&C Workshop. SIS, 1994:2, p. 30.
- Dalrymple. The Age of the Earth. 1991, p. 89.
- Curie. Radioactive Substances. Reprint edition 1971, p. 6.
- Jueneman. “Will the Real Monster Please Stand Up.” Industrial Research, Sept., 1972, p. 15.
- Sanders. “Implications for 14C Dating.” p. 1. http://arxiv.org/ftp/arxiv/papers/0808/0808.3986.pdf
- Pease. “Supernova Brightens the Horizon.” Nature, April 15, 1993, p. 585.
- Morrison, “Wonders: On Neutrino Astronomy.” Scientific American, Nov. 1995, p. 108.
- AMS: Accelerator Mass Spectrometry. A highly sophisticated scientific technique designed to measure different elements, and even to distinguish their rare isotopes. Of particular interest is its ability to identify quantities of the rare C14 relative to the abundant C12, and do so using smaller amounts of sample material.
- Rafter Radiocarbon Laboratory GNS Science. http://www.gns.cri.nz/Home/Services/Laboratories-Facilities/Rafter-Radiocarbon-Laboratory/Measuring-Radiocarbon/Accelerator-Mass-Spectrometry.
- There are several isotopes of carbon, with C12 being the most abundant (98.90%), C13 next at (1.10%), CRC Handbook of Chemistry and Physics, 72nd ed. 1991, p. 11.29. Radioactive C14 is less than 0.0000000001% of total carbon on the earth, Higham. “Radiocarbon Web-info.” http://www.c14dating.com/int.html, p. 2.
- Nitrogen-14 is the most abundant element in Earth’s atmosphere, about 78% by volume. CRC Handbook of Chemistry and Physics, 72nd ed. 1991, p. 4.19.
- Cosmic rays are high-energy nuclear particles which continuously bombard the earth from all directions. CRC Handbook of Chemistry and Physics. 1991, p. 11.133. Cosmic rays travel at nearly the speed of light. These collisions cause cascades of secondary nuclear particles, some of which are free neutrons. McGraw-Hill Concise Encyclopedia of Science. 1997, pp. 501, 1289-1290.
- Hedges and Gowlett. “Radiocarbon Dating by AMS.” Scientific American, Jan. 1986, p. 100.
- Faure. Principles of Isotope Geology. 1977, p. 307.
- Libby. Radiocarbon Dating, 2nd Ed. 1955, pp. 8-9.
- Libby. “Radiocarbon Dating.” Science, March 3, 1961, p. 622.
- Ibid.
- Lingenfelter. “Production of Carbon 14 by Cosmic-Ray Neutrons.” Reviews of Geophysics. 1963, p. 51.
- Ramsey. “Radiocarbon Dating.” Archaeometry, Vol. 50, #2, 2008, pp. 5, 9.
- Cook. Scientific Prehistory. 1993, p. 11.
- Cook. The Autobiography of Melvin A. Cook. Vol. 2. 1977, p. 72.
- Libby. “Natural Radiocarbon and Tritium.” In Radiocarbon and Dating. 1965, p. 749.
- Heliacal: of or near the sun; the apparent rising, or setting, of a star or planet just after conjunction with the sun. Webster’s College Dictionary, 4th ed. 2005.
- Damon et al. “Fluctuation of Atmospheric C14.” In Radiocarbon and Dating. June 7-11, 1965, p. 417.
- Becker. “History of Radiocarbon Calibration.” In Radiocarbon after Four Decades. 1992, pp. 34-48.
- Pearson, Pilcher, and Baillie. “High-Precision 14C Measurement.” Radiocarbon, Vol. 25, 1983, p. 184.
- Porter. “Recent Developments in Archaeology.” C&C Review. SIS, 2002:1, p. 14.
- Newgrosh. “Calibrated Radiocarbon.’” C&C Review. SIS, 1991, p. 37.
- Porter. “Ai, Jericho and ‘Deviant’ C14 Dates.” C&C Review. SIS, 1992, p. 26.
- Libby. “Natural Radiocarbon and Tritium.” In Radiocarbon and Dating. 1965, p. 747.
- Goodfriend and Hood. “Carbon Isotope Analysis.” Radiocarbon, Vol. 25, No 3, 1983, p. 827.
- Libby. “Radiocarbon Dating.” Science, March 3, 1961, p. 622.
- Shackleton et al. “Radiocarbon Age of Deep Water.” Nature, Oct. 20, 1988, p. 709.
- Keith and Anderson. “Radiocarbon: Fictitious Results.” Science, Vol. 141, no. 3581, 1963, p. 636.
- Hedges. “Sample Treatment in 14C Dating.” In Radiocarbon after Four Decades. 1992, p. 173.
- Libby. Radiocarbon Dating, 2nd Ed. 1955, p. 11.
- Keenan. “Why Early Radiocarbon Dates Downwind are Too Early.” Radiocarbon, Vo. 44, #1, 2002, p. 232.
- Van der Merwe. Carbon-14 Dating of Iron. 1969, p. 66.
- The inner rings are the oldest while the outer rings are the most recently grown.
- Lasken. “Misusing Radiocarbon.” C&C Review. SIS, 1992, pp. 17-18.
- Taylor. “Radiocarbon Dating of Bone.” In Radiocarbon after Four Decades. 1992, pp. 375, 377.
- Bard et al. “Calibration of the 14C Timescale.” Nature. May 31, 1990, p. 405.
- Ibid., p. 408.
- Judson and Kauffman. Physical Geology, 8th ed. 1990, p. 3.
- Absolute time. McGraw-Hill Dictionary of Scientific and Technical Terms. 1974.
- Roth. “Dating Using Radioactive Phenomena.” In Nuclear Methods of Dating. 1989, p. 4.
- Aitchison and Scott. “A Review of Calibrating.” In Applications of Tree-Ring. 1987, pp. 188-189.
- Beal. “A Bit Creaky?” C&C Review. SIS, 1991, p. 40.
- Pearson, Pilcher, and Baillie. “High-Precision 14C Measurement.” Radiocarbon, 1983, p. 184.
- Newgrosh. “Scientific Dating Methods.” Journal of the Ancient Chronology Forum, Vol. 2, 1988, p. 67.
- Ramsey. “Radiocarbon Dating.” Archaeometry, Vol. 50, #2, 2008, p. 28.
- Brier. Ancient Egyptian Magic. 1981, p. 14.
- Standring. “Pot Pourri.” C&C Review. SIS, 2001:2, p. 50.
- Tautology: a needless repetition of an idea. Often, the restated version is intended to establish the validity of the first, or visa versa.
- Higham. “Radiocarbon Web-info.” http://www.c14dating.com/int.html, (last accessed 9/4/12).
- Ham et al. “How Accurate are Carbon-14 and Other Radioactive Dating Methods?” http://christiananswers.net/q-aig/aig-c007.html?zoom_highlight=how+the+carbon+clock+works. (last accessed 9/4/12)